IPKO data for mobility analysis across Kosovo
IPKO’s data can provide unparalleled insights into local and national trends and events, enabling robust decision-making support for both government and the private sector. With secure processing of hundreds of millions of mobility data points, IPKO ensures privacy and precision in transforming raw data into valuable intelligence.
Understanding where people are and when they move not only aids in the production of official statistics but also offers valuable insights across key sectors—such as crisis response (both short- and long-term), tourism, public health, transportation and infrastructure planning, as well as market research on the attractiveness of existing and new developments.
In this report, we highlight key mobility trends across Kosovo, including the return of the diaspora during the Summer season. We also feature three periods of interest that show how mobility patterns respond to both expected and unexpected events: the impact of storms and heavy rainfall in late June 2024 that reduced travel nationwide, and the diffused, family-driven movements during the Eid al-Fitr holidays on April 9th and 10th. These are examples of how CDRs could in the future help inform infrastructure planning, economic strategy, or understand social ties shaping travels in Kosovo.
We also highlight potential questions that could guide the direction of future work, providing a foundation for exploring new opportunities. Additionally, we showcase two successful examples of how mobile phone data has been effectively used to aid transportation planning.
It should be noted that in this report, we show examples of insights and value that can be generated from mobility data produced from IPKO Telecommunications’ Call Detail Records (CDRs). This is not an exhaustive list of all possible insights that could be gained from CDR data. These are introductory estimates that are not controlled for biases such as IPKO’s subscriber base not fully representing the demographics or behaviors of the entire population in Kosovo. Ensuring proper representation (or at least adjusting for bias) is critical for interpreting these results accurately, as variations in market share, regional coverage, and subscriber characteristics can influence findings. Future analyses should account for these factors to provide more precise and representative insights.
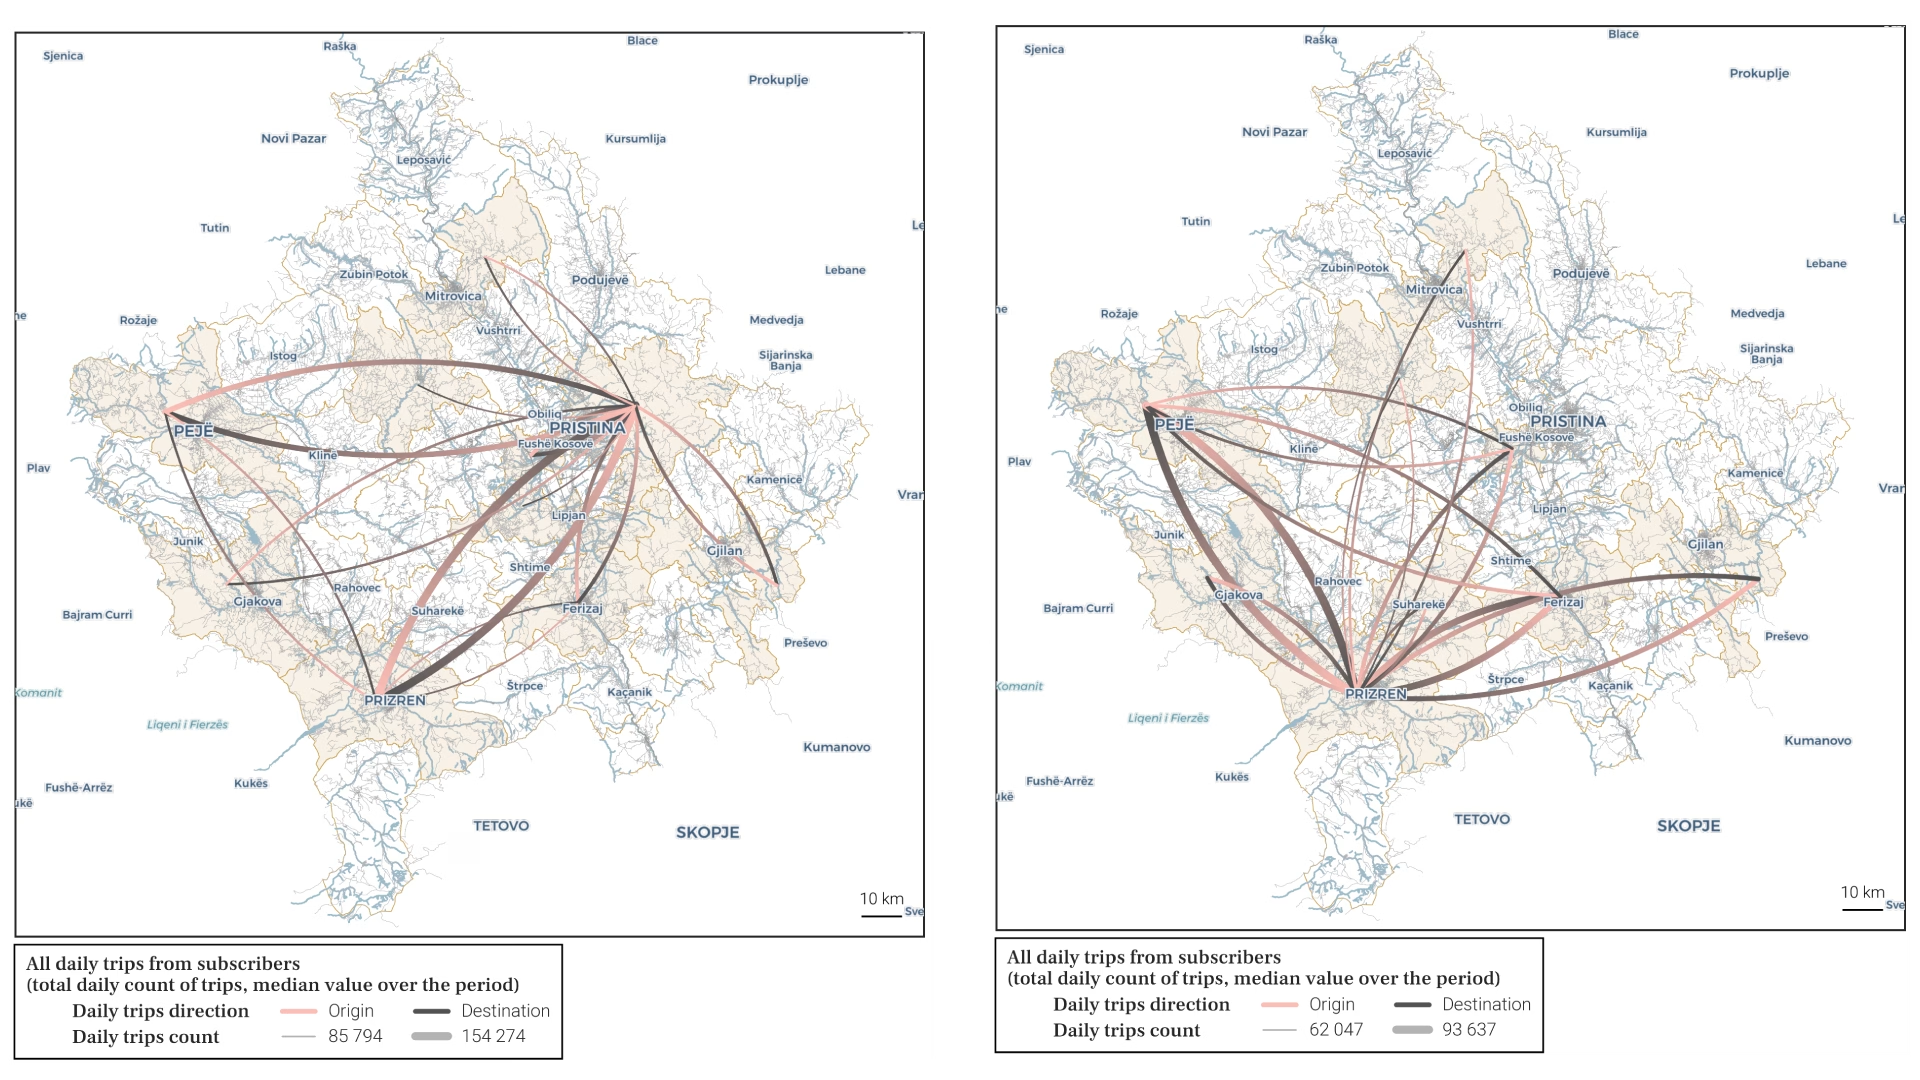
Figure 1. Largest 20 connections between municipalities, average (median) number of daily travellers during the period (January to July 2024) between two municipalities.
Figure 2. Largest 20 connections between municipalities excluding Pristina, average (median) number of daily travellers during the period (January to July 2024) between two municipalities.
IPKO data can provide country level insights into the movement of subscribers around Kosovo. The above Figures 1 and 2 are based on the all-pairs trips aggregate at municipal level. We can clearly see that Pristina is a center for most of the largest movements in the country, with Pristina and Prizren having the strongest link between any two municipalities in Kosovo (approximately 154 000 daily travellers between them on average, for both directions).
Here, it is important to note that the same traveller can be counted multiple times in different connections (for example, a traveler from Prizren passing by Ferizaj to go to Pristina will be counted both in the Prizren to Pristina and Ferizaj to Pristina connections), thus travellers cannot simply be summed to obtain the total count of unique travellers to or from a single municipality.
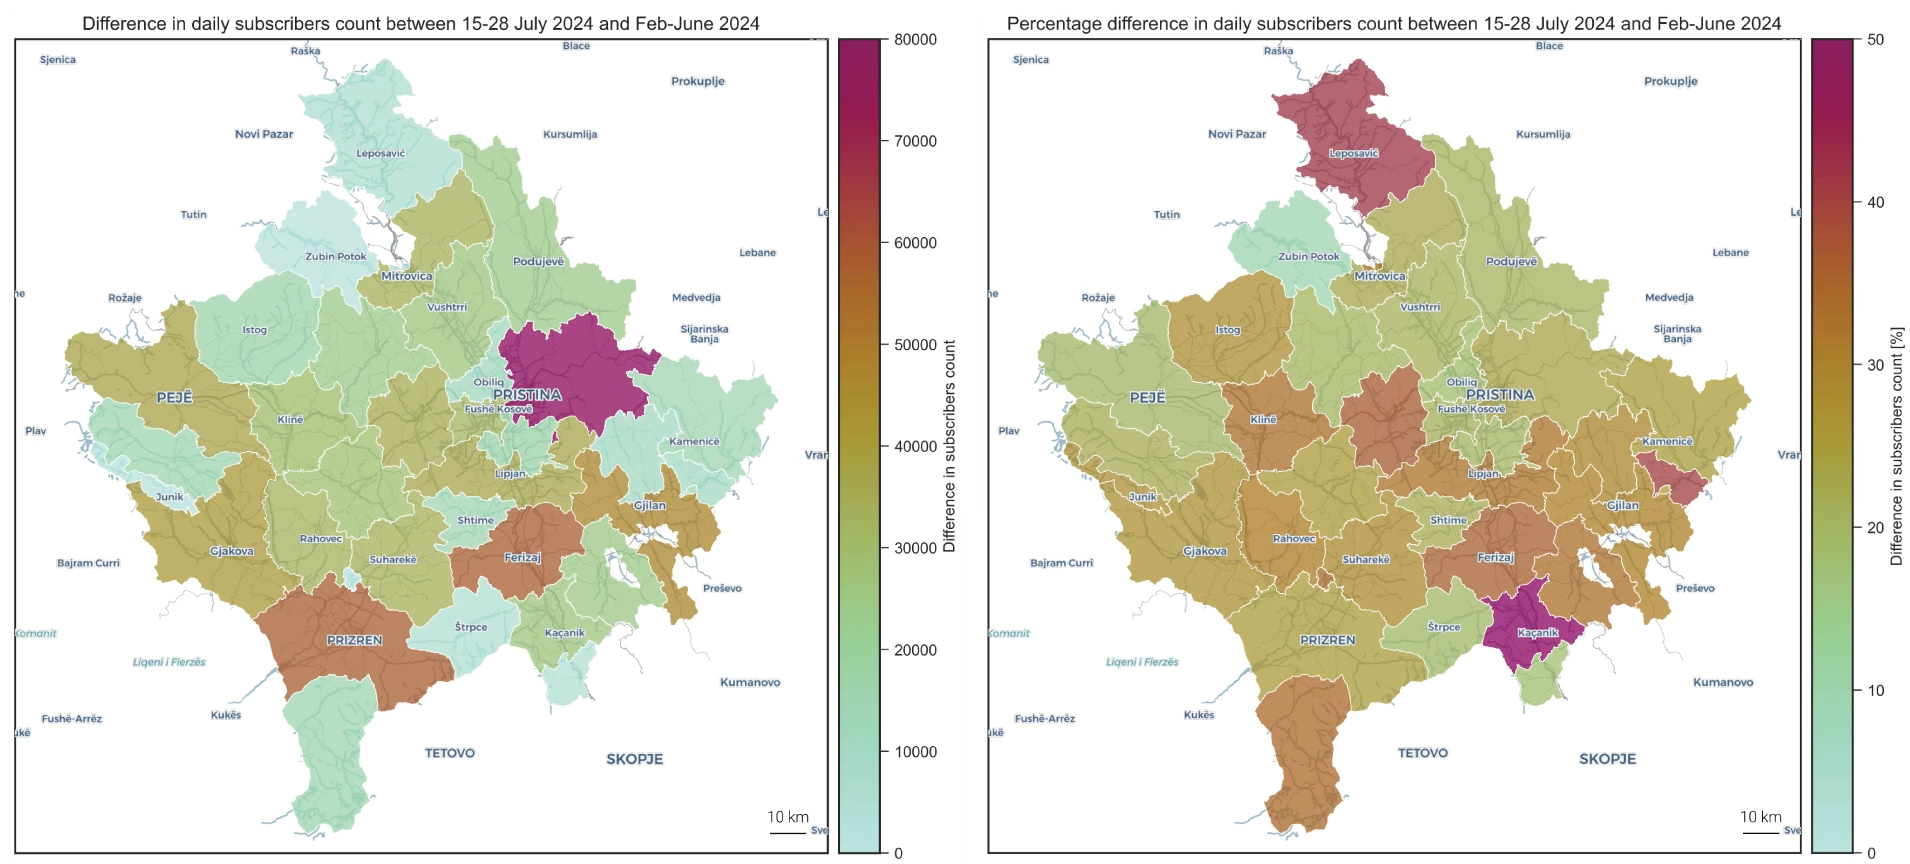
Figure 1. Absolute difference in subscriber presence, between the median subscriber count of a “normal” period (February to June 2024), and the median subscriber count of the summer period (15 to 28 July 2024), for each municipality.
Figure 2. Relative difference in subscriber presence, between the median subscriber count of a “normal” period (February to June 2024), and the median subscriber count of the summer period (15 to 28 July 2024), for each municipality.
IPKO data provides insights into changes in mobility during different seasons. Figures 4 and 5 above are derived from the unique subscribers count aggregate at municipal level. During the month of July, we observe a large increase (approximately 25%) in the number of subscribers in the country as a whole, which may be attributed in large part to the return of the diaspora and general tourism in the country. The largest absolute increases in presence occur with the municipalities of Pristina (approximately +80 000 subscribers) and Ferizaj/Prizren (approximately +60 000 subscribers), while the largest relative increases happen in the municipalities of Kaçanik (approximately +57%) and Ranillug/Leposaviq (approximately +40/41%).
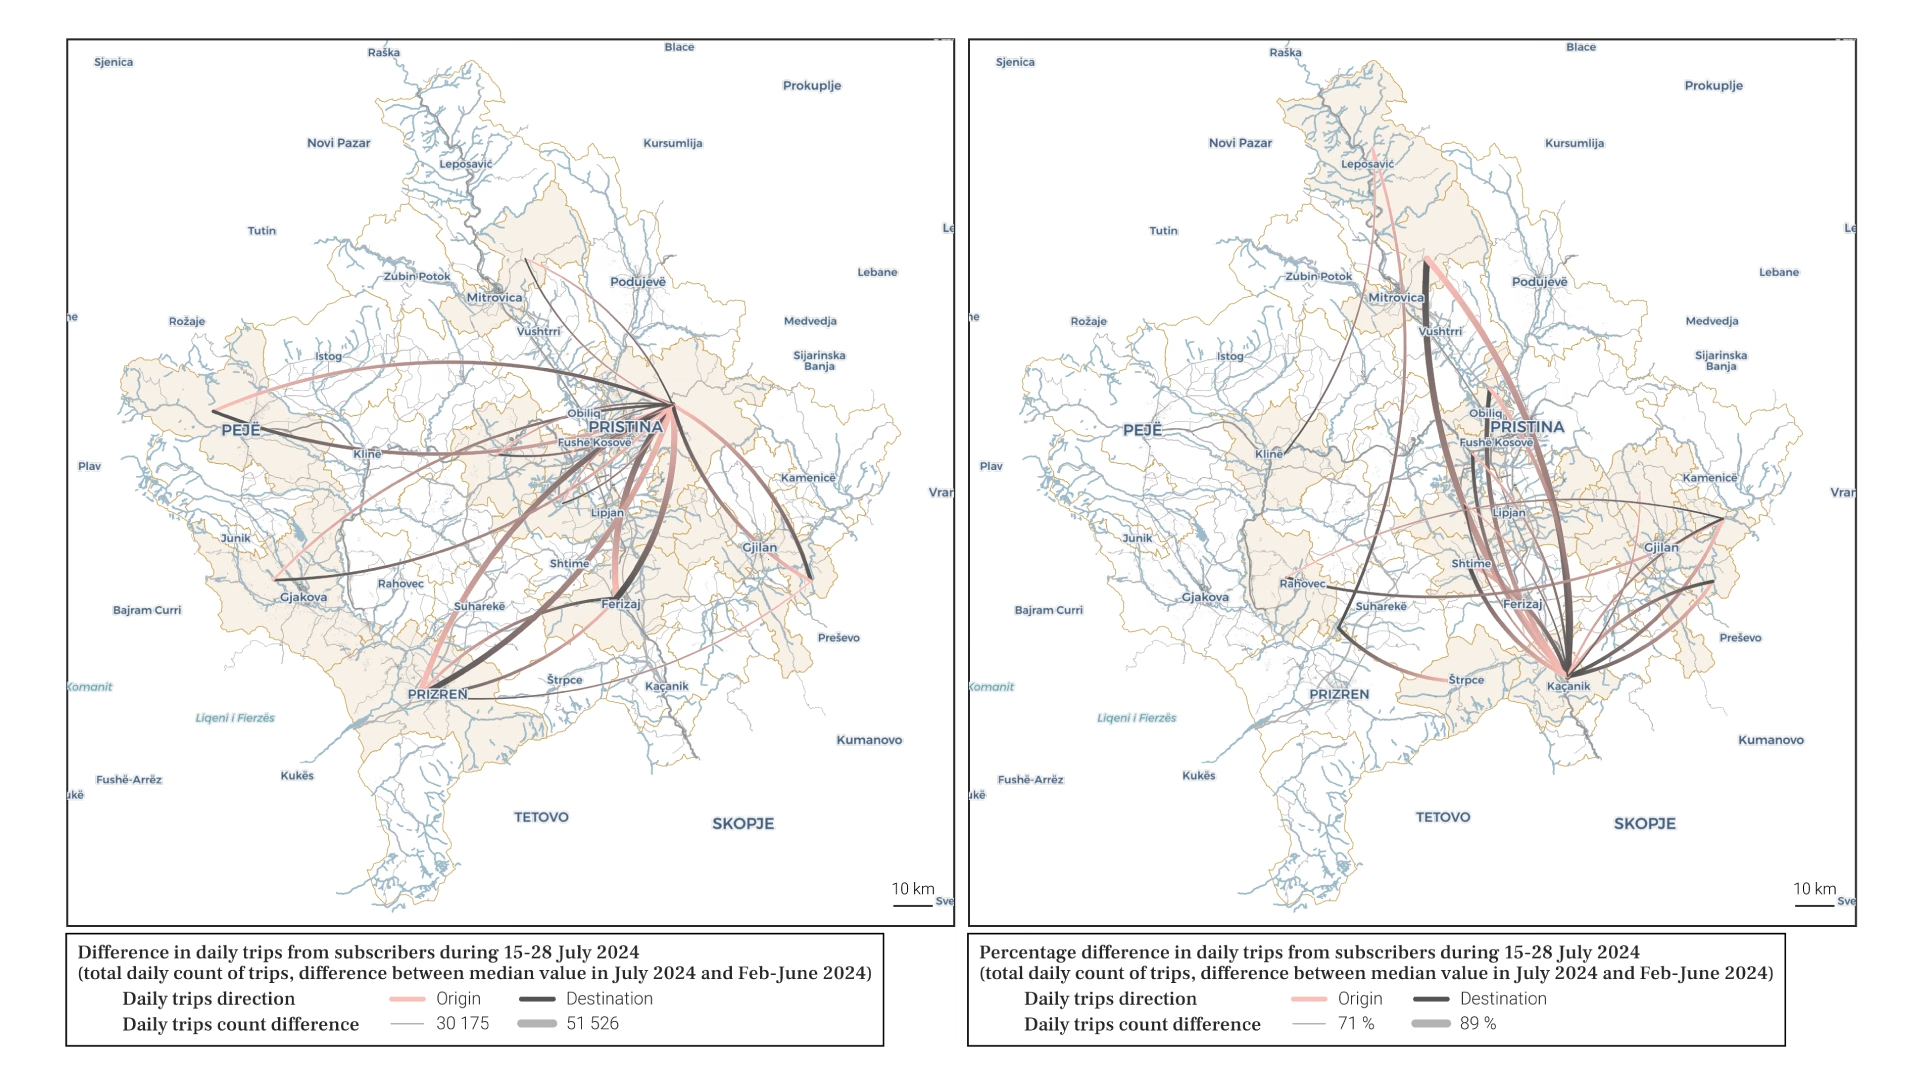
Figure 1. Largest 20 connections between municipalities with the largest absolute difference in average (median) number of daily travellers, between a “normal” period (February to June 2024), and the summer period (15 to 28 July 2024), between two municipalities.
Figure 2. Largest 20 connections between municipalities with the largest relative difference in average (median) number of daily travellers, between a “normal” period (February to June 2024), and the summer period (15 to 28 July 2024), between two municipalities.
The above Figures 1 and 2 are based on the all-pairs trips aggregate at municipal level. Similarly with the average increase in presence previously, the pair of municipalities with the largest increase in travellers between them are Pristina and Ferizaj as well as Pristina and Prizren (approximately +50 000 subscribers for both connections, in both directions). When examining relative changes, municipalities on the country’s borders, such as Kaçanik and Leposaviq, stand out. This is likely due to Kosovars traveling abroad (toward Macedonia, Greece, or Serbia) during vacations. Domestic trips reveal a clear new travel axis connecting Mitrovica, Pristina, and Kaçanik, on a north to south-east axis.
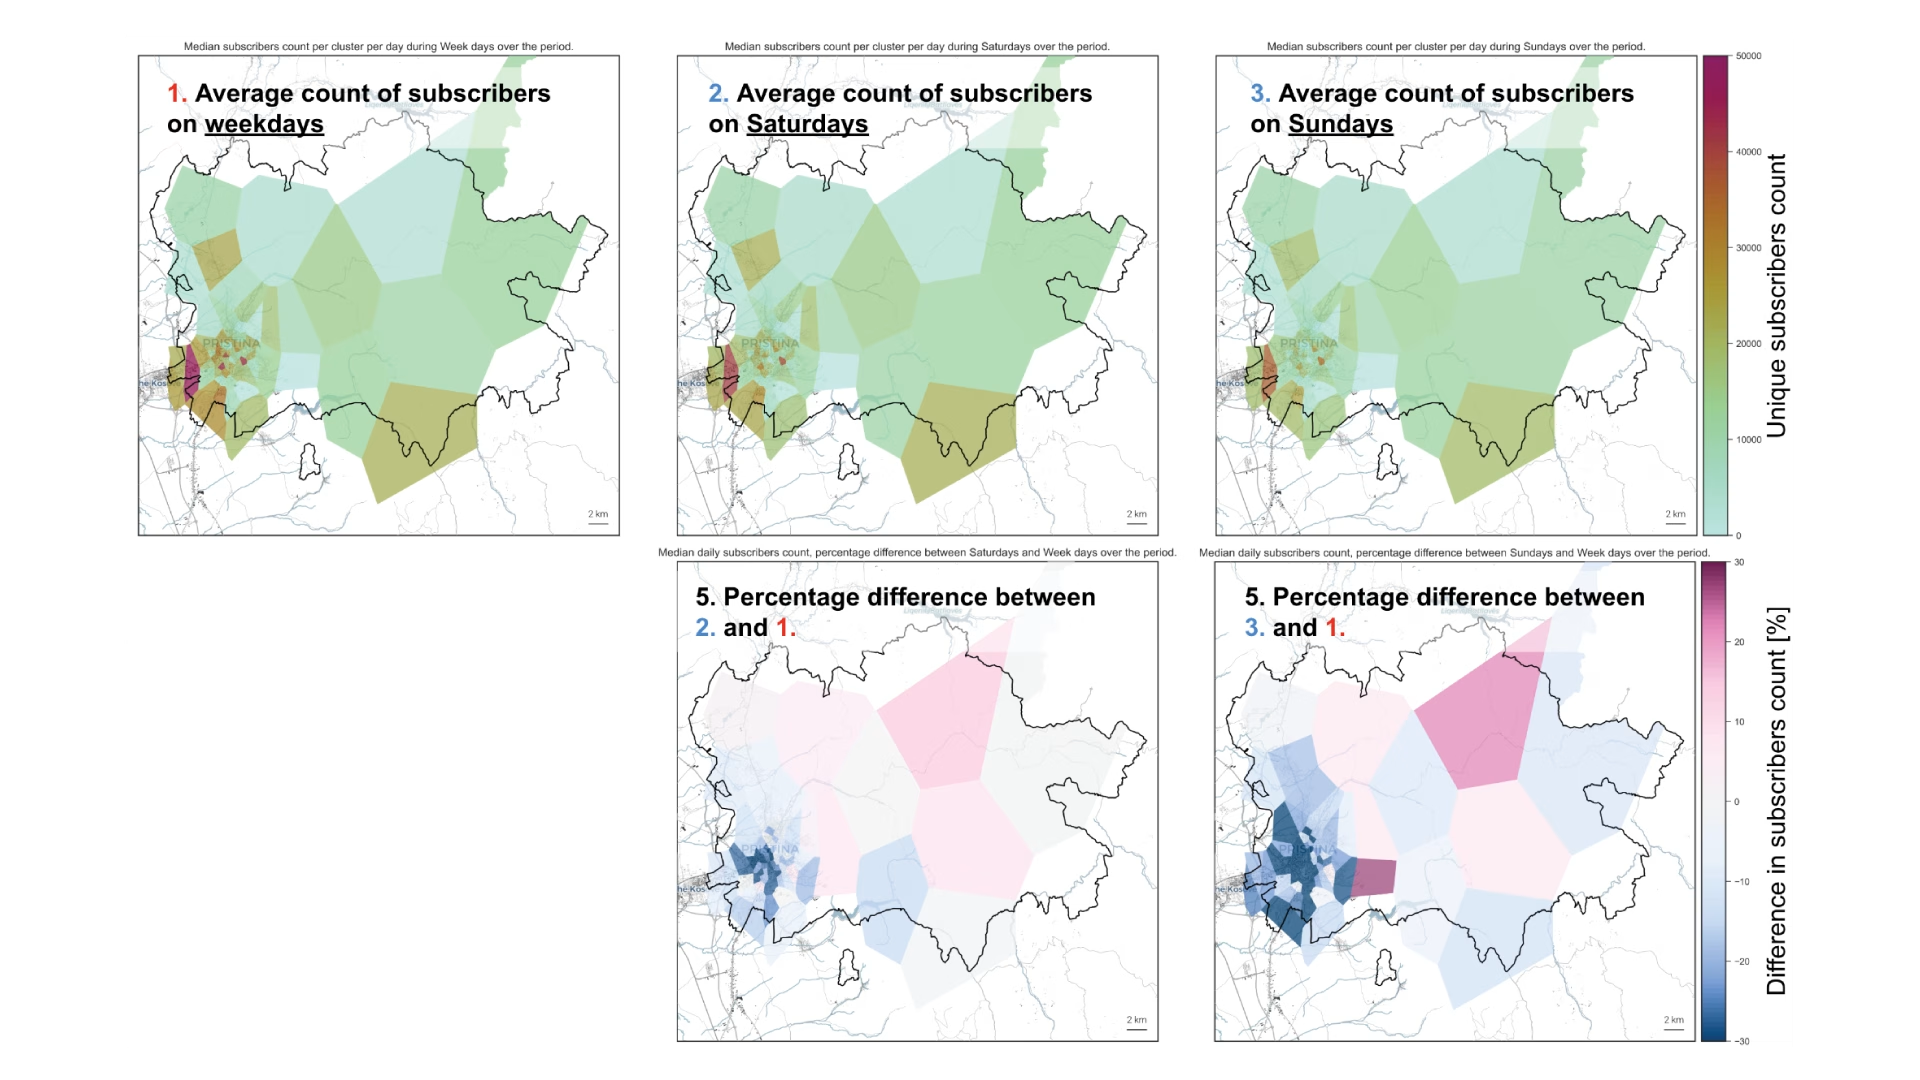
Figure Panel. Average (median) count of unique subscribers at cluster level in the municipality of Pristina for specific parts of the week (Panel 1: weekdays, Panel 2: Saturdays, Panel 3: Sundays) over the full time period. Relative differences in subscriber presence between Saturdays and weekdays (Panel 4) or Sundays and weekdays (Panel 5) are also shown.
IPKO data reveals within-municipality dynamics. Figure 8 above is derived from the unique subscribers count aggregate at cluster level. When looking at the difference in presence between different days of the week, for example between Sundays and weekdays (Panel 5), we can observe some key variations in presence inside the municipality. For example, some natural areas (on the eastern part of the municipality) have more visitors during the weekend (>15% than on weekdays), while on the other hand, the city centre sees fewer visitors than on weekdays (>20% less). Generally, combining and comparing this dynamic population information with traditional sources of static population statistics can help measure the attractivity of localities, and offer a dynamic view on presence in an area.
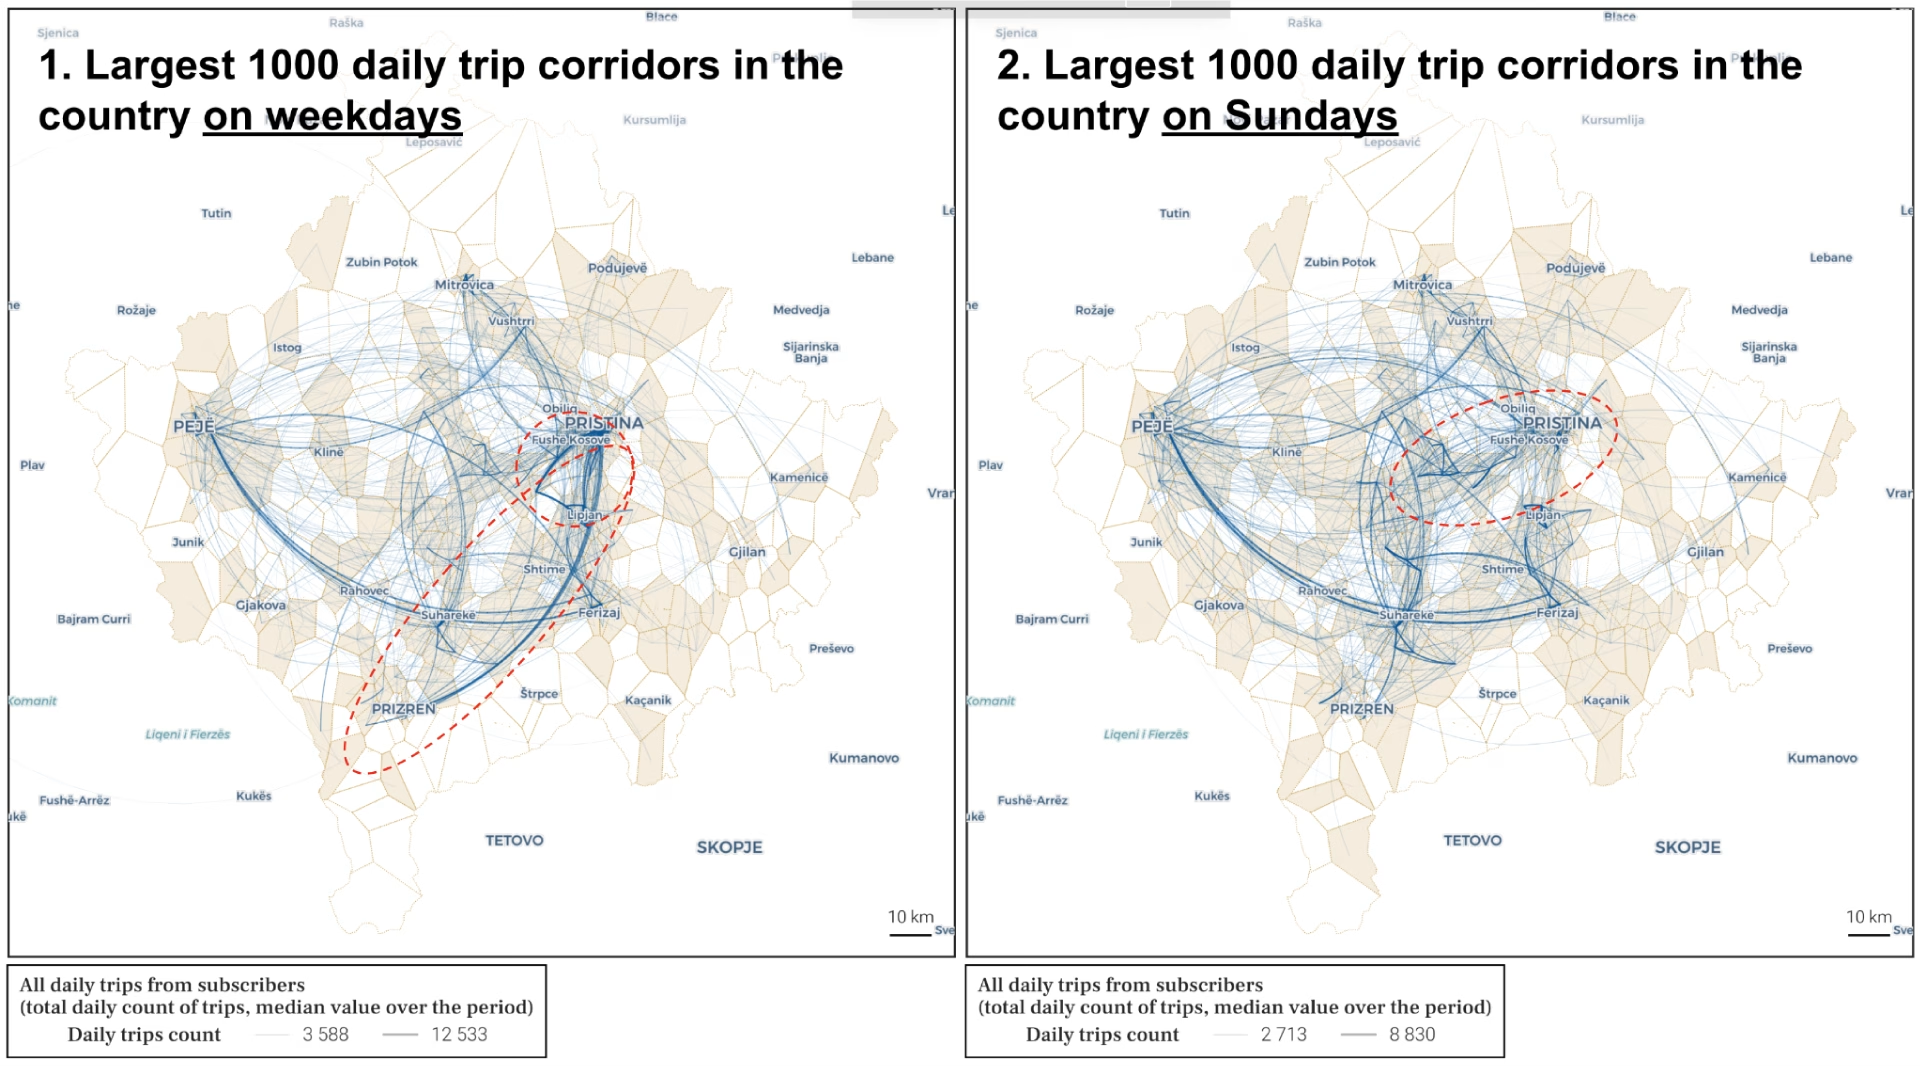
Figure Panel . Panel 1 shows the largest (by median number of daily travellers over the full period) 1000 connections between clusters in the country for weekdays. Panel 2 shows the same metric for Sundays instead. We measure here “unidirectional flows”, i.e. the average number of trips between two clusters (independently of the direction, i.e. trips from A to B and from B to A are both averaged to one AB value).
IPKO data provides insights into rapid changes in mobility across Kosovo. Figure 14 above is based on the all-pairs trips aggregate calculated at cluster level. It shows typical mobility patterns in the country, which we can assume are primarily driven by home-to-work travels during weekdays, and leisure activities during the weekend (Sundays here in Panel 2). Some of the significant and apparent mobility patterns are highlighted by red circles on the Figure.
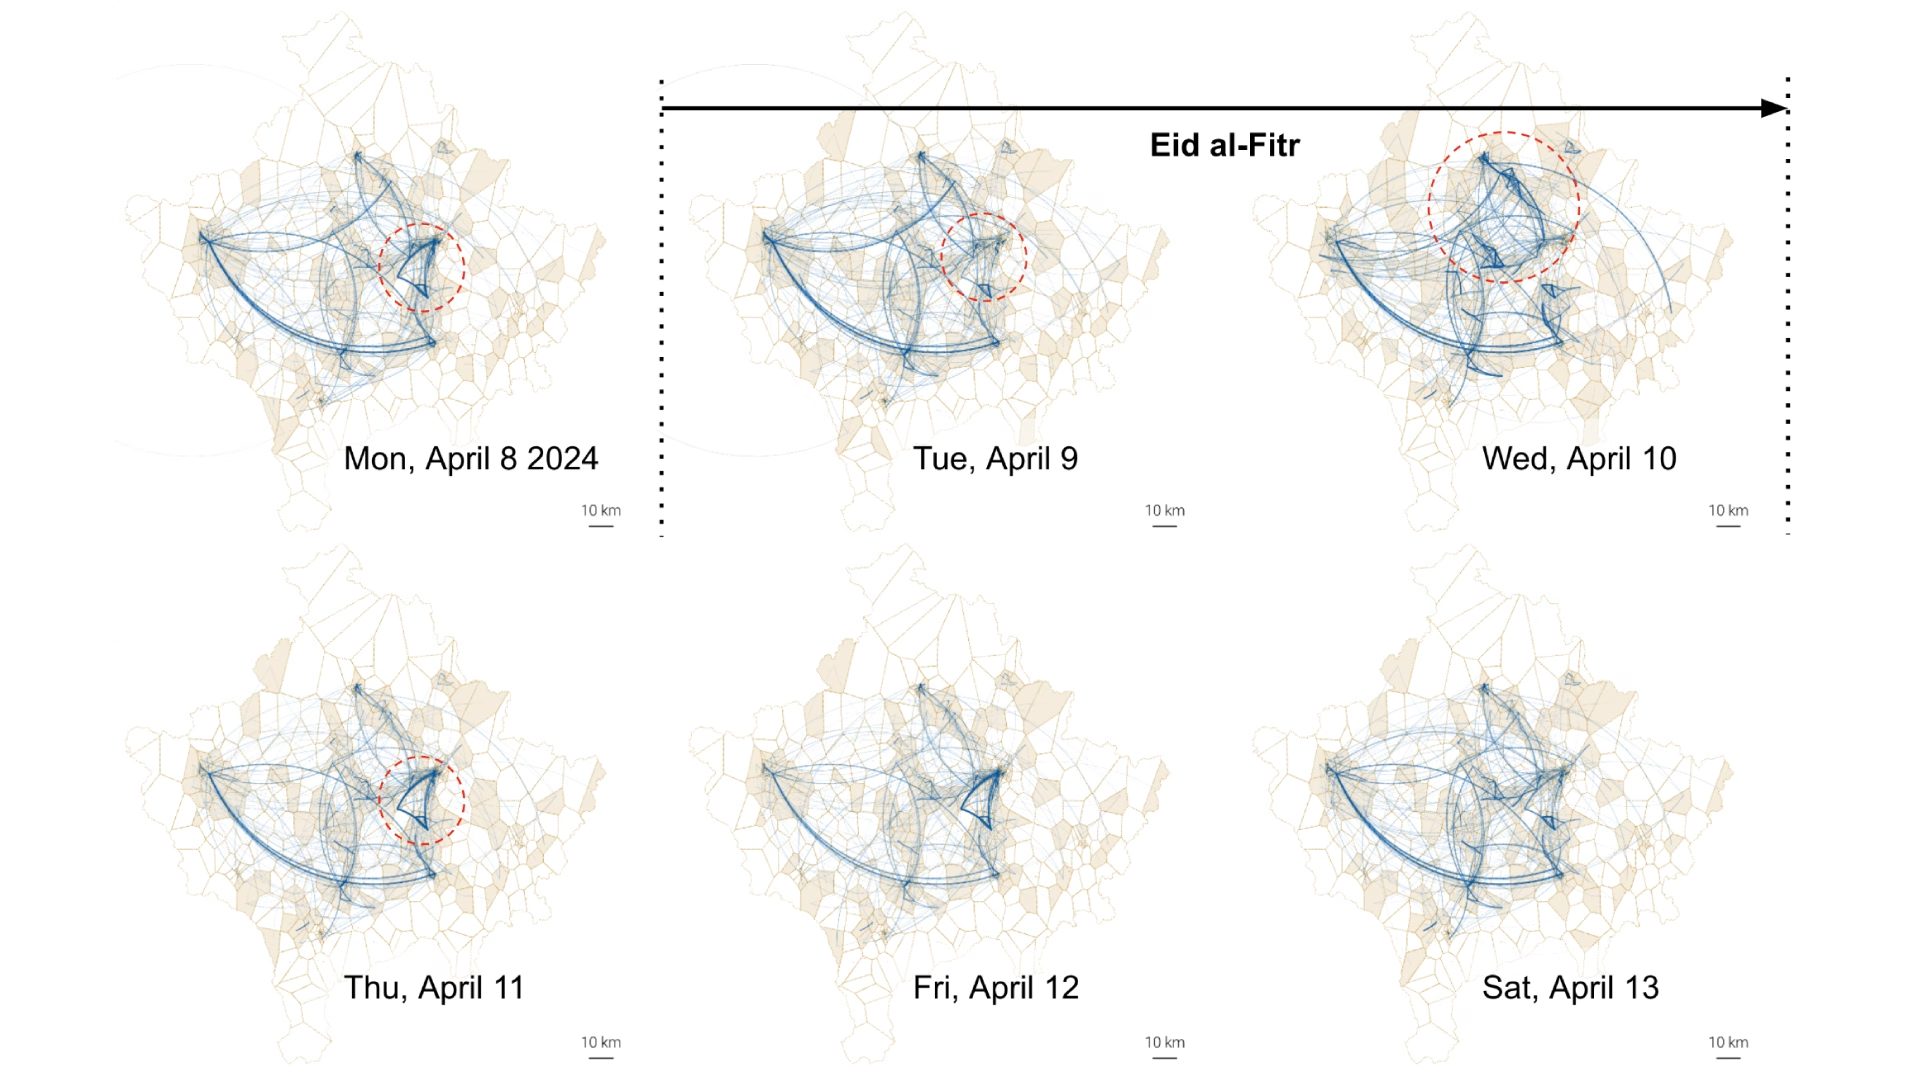
Figure Panel . Timeline of the largest (by number of daily travellers on the day) 500 connections between clusters, for each of the day considered. We also measure here “unidirectional flows”, i.e. the average number of trips between two clusters (independently of the direction, i.e. trips from A to B and from B to A are both averaged to one AB value).
When looking again at the timeline of a specific time period instead (Eid al-Fitr on April 9th and 10th, shown in Figure 15 here based on the same aggregate), we can see that those typical mobility patterns shift, as friends and families reunite to celebrate. As travel purpose changes during this holiday, new mobility patterns emerge. Comparing usual mobility patterns (e.g., home-to-work travel) with those driven by events or celebrations can serve a wide variety of purposes, such as understanding the social connections influencing mobility or potentially providing insights into the spread of diseases.
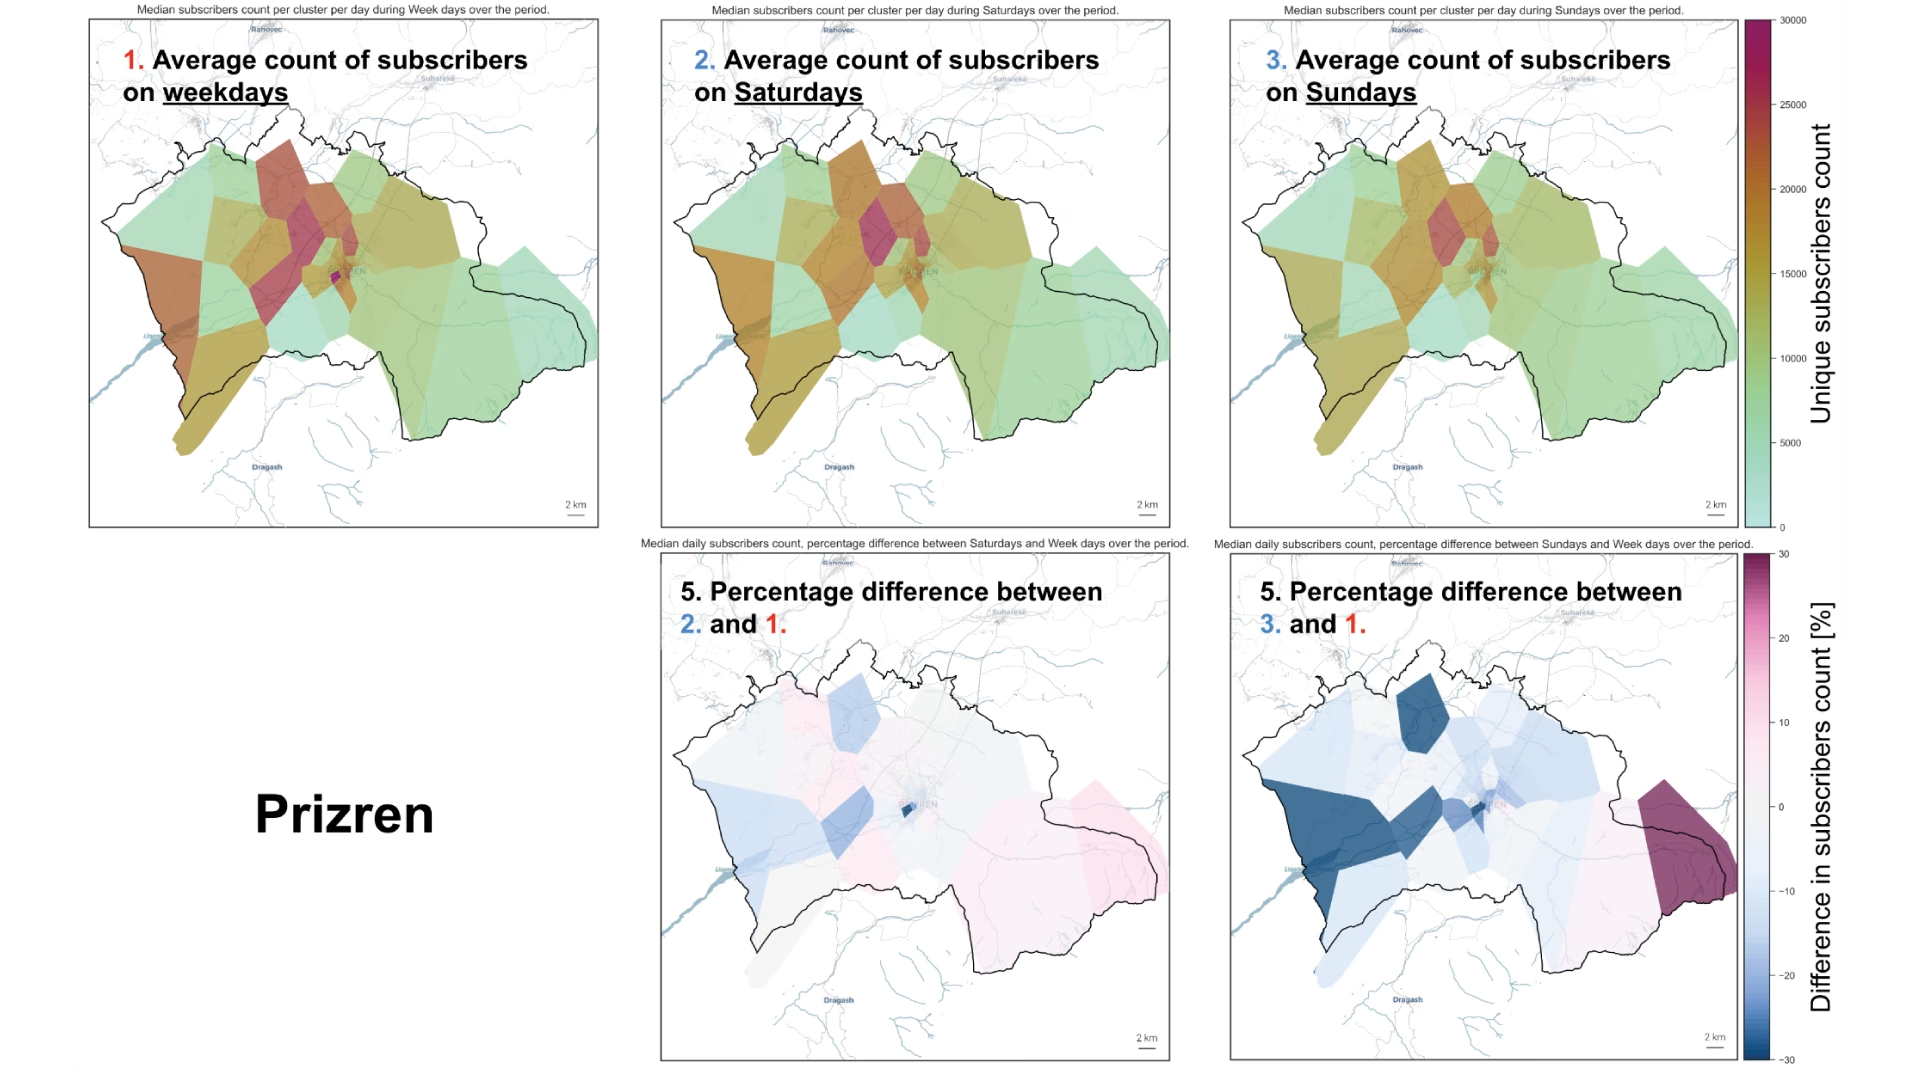
Average (median) count of unique subscribers at cluster level in the municipality of Prizren for specific parts of the week (Panel 1: weekdays, Panel 2: Saturdays, Panel 3: Sundays) over the full time period. Relative differences in subscriber presence between Saturdays and weekdays (Panel 4) or Sundays and weekdays (Panel 5) are also shown.
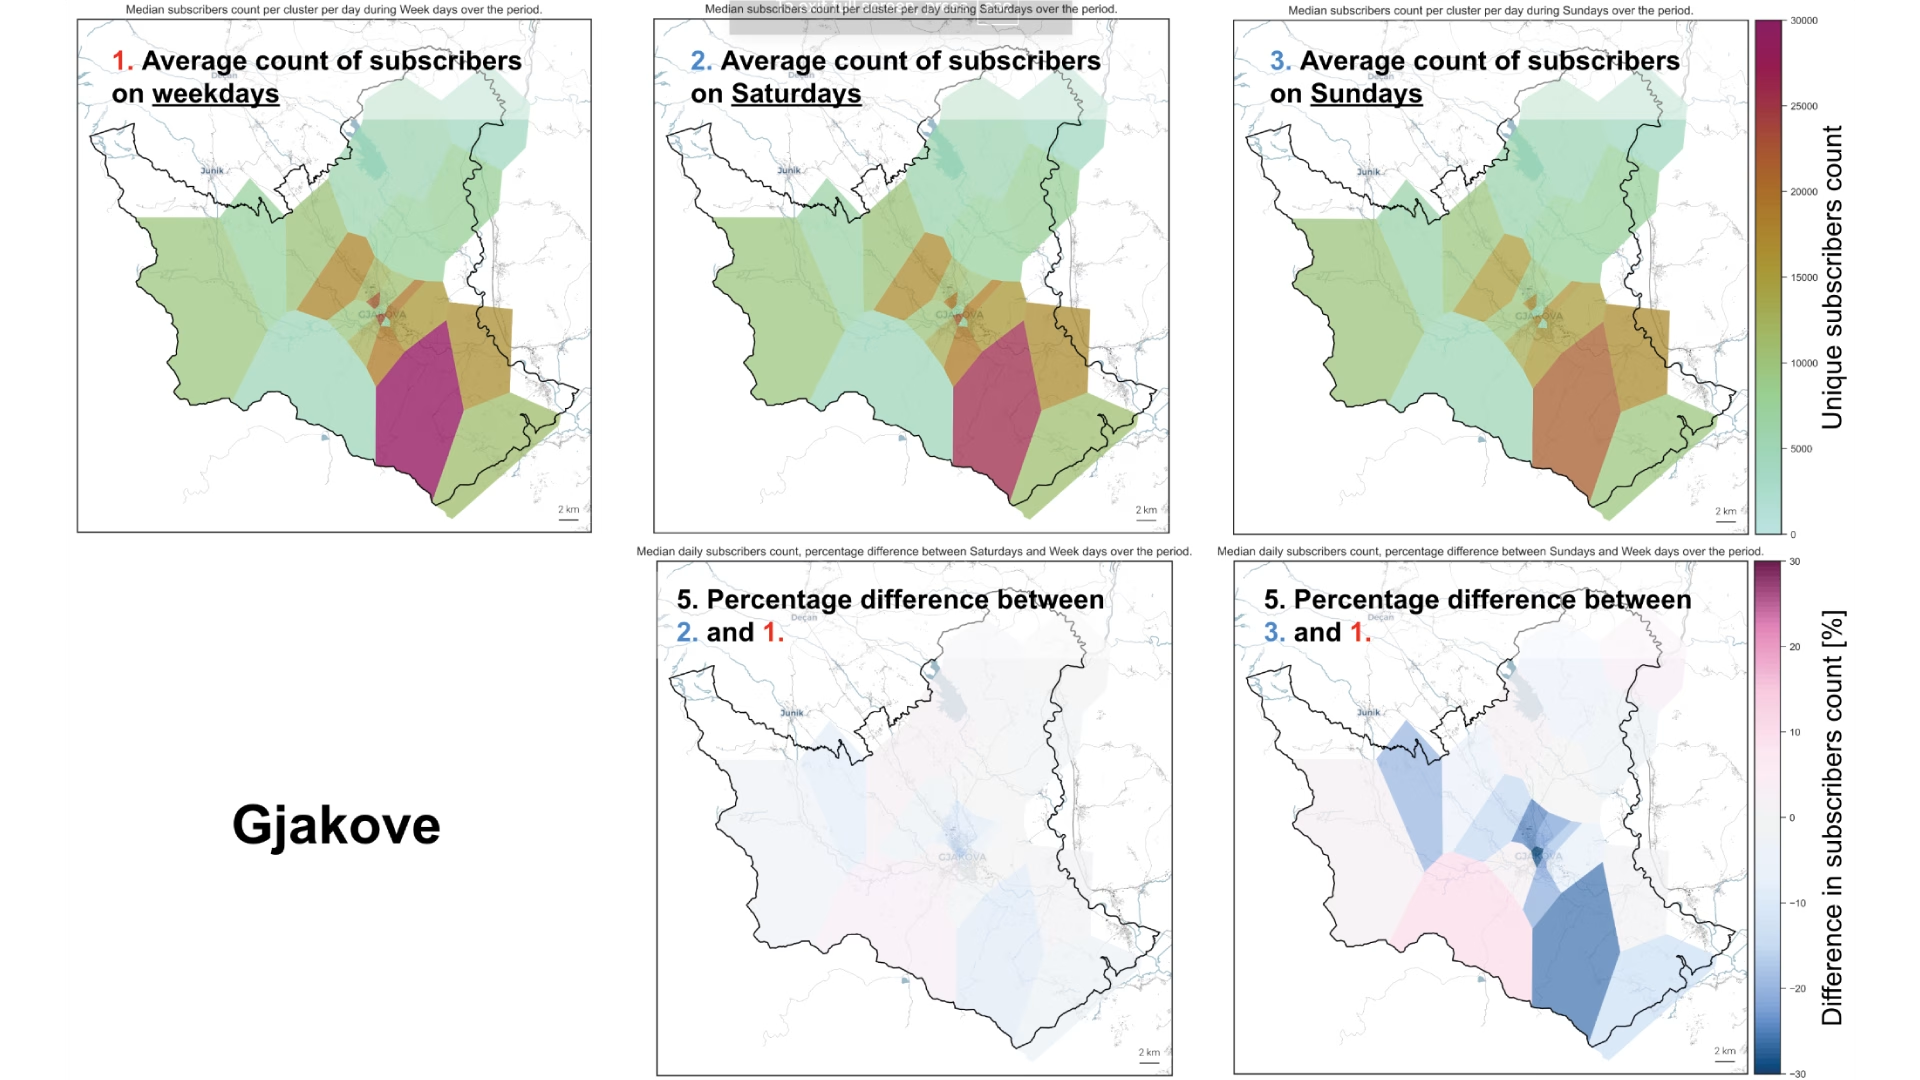
Average (median) count of unique subscribers at cluster level in the municipality of Gjakove for specific parts of the week (Panel 1: weekdays, Panel 2: Saturdays, Panel 3: Sundays) over the full time period. Relative differences in subscriber presence between Saturdays and weekdays (Panel 4) or Sundays and weekdays (Panel 5) are also shown.
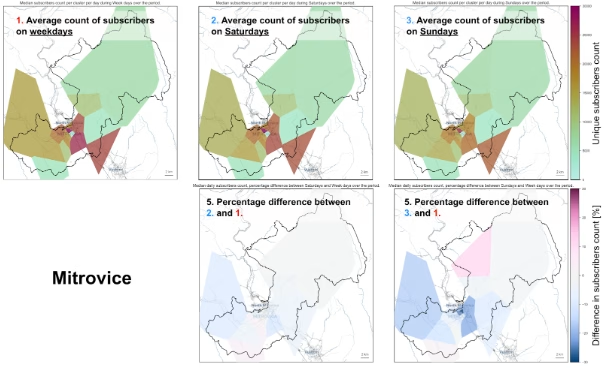
Average (median) count of unique subscribers at cluster level in the municipality of Mitrovice for specific parts of the week (Panel 1: weekdays, Panel 2: Saturdays, Panel 3: Sundays) over the full time period. Relative differences in subscriber presence between Saturdays and weekdays (Panel 4) or Sundays and weekdays (Panel 5) are also shown.
The previous section demonstrates the types of mobility insights that can be derived from IPKO’s CDR data. This section invites potential stakeholders to think about the unique questions and challenges they face, as we can design tailored projects to address your specific interests and priorities. The examples below are not exhaustive—there is so much more that can be uncovered with targeted analyses based on your needs.
Mobility data can provide a comprehensive understanding of traffic flows and commuting patterns, helping to identify critical routes and areas requiring infrastructure investment. Insights can be used to plan more efficient public transport systems, reduce congestion, and enhance connectivity between high-traffic locations.
Answering questions such as:
Understanding seasonal and regional mobility patterns is essential for maximizing the impact of tourism initiatives. Mobility data can help identify key trends, assess visitor inflows, and optimize resource distribution to meet fluctuating demand.
Answering questions such as:
Mobility data plays a critical role in understanding population dynamics, especially during health crises. It can help identify high-density areas, monitor movement during outbreaks, and guide the allocation of resources to areas with higher needs.
Answering questions such as:
Mobility insights can guide businesses and policymakers by identifying key economic hubs, understanding consumer behaviors, and assessing the impacts of new developments or events.
Answering questions such as:
During emergencies, mobility data can provide real-time insights into population movements, helping authorities plan effective responses and allocate resources where they are needed most.
Answering questions such as:
Si eshte eksperienca ne webin e IPKO’s?
Ju lutem kurseni pak minuta për të ndarë eksperiencën tuaj në lidhje me ueb faqen tonë.